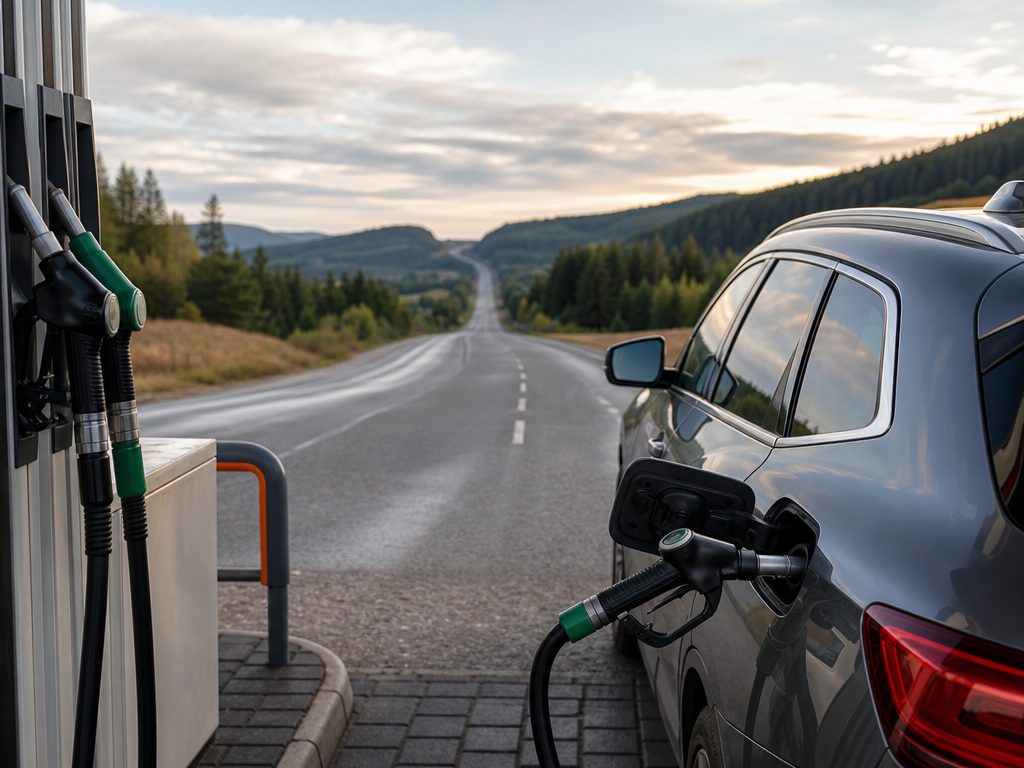
Real-world efficiency falls below the rated figure in cold weather, at speed, with a loaded vehicle, and in stop-start traffic.
The Mathematics of Fuel Cost: Core Formulas and Calculations
To accurately budget for any road trip, you must first master the basic mathematical formulas that govern fuel consumption. Whether you measure distance in miles and fuel in gallons, or distance in kilometers and fuel in liters, the underlying logic remains identical: you are calculating the total volume of fuel required to cover a specific distance and multiplying that volume by the unit cost of the fuel.
For drivers in the United States and other regions utilizing imperial or US customary units, the calculation relies on Miles Per Gallon (MPG). The formula to determine the total gallons of fuel required is:
Fuel Used (Gallons) = Trip Distance (Miles) / Fuel Economy (MPG)
Once you have established the total gallons required, you calculate the overall cost by multiplying this volume by the current price of fuel per gallon:
Total Fuel Cost = Fuel Used (Gallons) * Fuel Price per Gallon
For example, suppose you are planning a road trip from Los Angeles to San Francisco, a distance of approximately 380 miles. Your vehicle has an average highway fuel economy of 25 MPG, and the average price of regular unleaded gasoline along your route is $4.50 per gallon. First, divide 380 miles by 25 MPG to get 15.2 gallons of fuel used. Then, multiply 15.2 gallons by $4.50 to find a total fuel cost of $68.40.
In Canada, Europe, and most other parts of the world, fuel efficiency is expressed as the volume of fuel (in liters) consumed to travel 100 kilometers (L/100 km). The formula to determine the total liters of fuel required is:
Fuel Used (Liters) = (Trip Distance (km) * Fuel Consumption (L/100 km)) / 100
To find the total cost, multiply the total liters by the price per liter:
Total Fuel Cost = Fuel Used (Liters) * Fuel Price per Liter
For example, imagine driving from Toronto to Montreal, a distance of roughly 540 kilometers. Your vehicle consumes an average of 8.0 liters per 100 kilometers, and fuel costs $1.60 per liter. First, multiply 540 km by 8.0 L/100 km and divide by 100 to get 43.2 liters of fuel used. Then, multiply 43.2 liters by $1.60 to find a total fuel cost of $69.12.
To understand the efficiency of your trip on a micro-level, you can calculate the cost per mile or kilometer by dividing the total fuel cost by the trip distance. Additionally, if you are traveling with a group, sharing the expense is straightforward: divide the total fuel cost by the number of passengers to find the cost per person. While these formulas provide a solid baseline, real-world variables often disrupt these clean mathematical models.
Sources: www.fueleconomy.gov, www.eia.gov
The Real-World Gap: Why Laboratory Ratings Fail on the Road
When vehicle manufacturers advertise fuel economy figures, they are presenting ratings determined under highly controlled laboratory conditions. In the United States, the Environmental Protection Agency (EPA) oversees these tests, which are conducted on dynamometers (treadmill-like devices) inside climate-controlled facilities. While these standardized tests allow consumers to compare different vehicle models on an equal playing field, they rarely reflect the complex, dynamic environments of actual highway and city driving.
In the real world, several factors immediately begin to degrade your vehicle's efficiency below its official rated figures. The most prominent of these is aerodynamic drag. As your vehicle moves forward, it must push through a column of air. The force required to overcome this aerodynamic resistance does not increase linearly with your speed; instead, it increases exponentially with the square of the vehicle's speed. Driving at 75 mph requires significantly more energy than driving at 55 mph, causing fuel economy to plummet.
Furthermore, real-world driving involves terrain variations that laboratory tests cannot fully replicate. Climbing steep mountain passes, navigating rolling hills, and driving on poorly paved or unpaved roads all demand more torque from the engine, which directly translates to increased fuel consumption. Even minor factors, such as driving against a strong headwind, can reduce your fuel economy by several miles per gallon over a long journey.
Finally, vehicle maintenance plays a critical role. A vehicle with worn spark plugs, a clogged air filter, misaligned wheels, or dragging brake calipers will operate far less efficiently than a perfectly maintained test vehicle. To obtain an accurate estimate for your trip, you must treat the manufacturer's rated MPG or L/100 km as an optimistic upper bound rather than a guaranteed baseline.
Sources: www.fueleconomy.gov
The Chill Factor: How Cold Weather and Winter Blends Drain Fuel
One of the most significant and frequently overlooked contributors to poor fuel economy is ambient temperature. Cold weather dramatically alters the physical and chemical properties of your vehicle, its fluids, and the fuel itself. According to data compiled by the U.S. Department of Energy and the EPA, conventional gasoline vehicles experience an average 15% drop in fuel economy at 20°F (-7°C) compared to mild weather at 77°F (25°C). For short trips of 3 to 4 miles, this efficiency loss can worsen to an astonishing 24%.
The impact is even more severe for hybrid-electric vehicles (HEVs) and plug-in hybrid electric vehicles (PHEVs). At 20°F, a hybrid vehicle's fuel economy can drop by 30% to 34%. This is primarily because hybrid systems rely heavily on maintaining an optimal battery operating temperature. In cold conditions, the internal combustion engine must run more frequently to keep both the passenger cabin warm and the battery pack within its safe operating temperature range, largely neutralizing the fuel-saving benefits of the electric motor.
Several distinct physical mechanisms drive this cold-weather efficiency penalty. First, engines take longer to reach their optimal operating temperature, during which they run a rich fuel-to-air mixture that burns more fuel. Second, engine oil and other drivetrain fluids thicken in the cold, increasing internal friction and mechanical drag. Third, tire pressure drops by roughly 1 PSI for every 10°F drop in temperature, which increases rolling resistance. Fourth, colder, denser air increases aerodynamic drag. Finally, winter fuel blends have 1.5% to 3% lower energy density than summer blends, meaning you must burn more fuel to cover the same distance.
Sources: www.fueleconomy.gov
Weight, Aerodynamics, and Cargo: The Cost of Overloading
When preparing for a major road trip, it is common to pack the vehicle to its maximum capacity with luggage, gear, and passengers. However, carrying this extra weight and altering the vehicle's aerodynamic profile has a measurable impact on your fuel budget.
Every additional 100 pounds (approx. 45 kg) loaded into your vehicle can reduce your fuel economy by about 1% to 2%. This effect is more pronounced in smaller, lighter vehicles than in large SUVs or trucks, as the cargo represents a higher percentage of the vehicle's total curb weight. The energy required to accelerate a heavier mass from a complete stop is significantly greater, meaning stop-and-go traffic becomes even more costly when your vehicle is fully loaded.
Even more detrimental than weight is the addition of external cargo carriers. Roof racks, cargo boxes, kayak mounts, and bicycle carriers severely disrupt the aerodynamic design of your vehicle. A large, roof-mounted cargo box can reduce fuel economy by 2% to 8% in city driving, but on the highway, where speeds are higher and aerodynamic drag is the dominant force, the penalty can soar to 10% to 25%. Rear-mounted cargo trays or bike racks also degrade efficiency, though generally to a lesser extent than roof-mounted options because they sit within the slipstream of the vehicle's cabin.
When planning your trip, consider the trade-offs of your packing strategy. If you must carry extra gear, placing it inside the vehicle or trunk is far more efficient than mounting it on the roof. If you must use an external carrier, a hitch-mounted cargo box is aerodynamically superior to a roof-mounted box. Additionally, always remove empty roof racks and mounts immediately when they are not in use to avoid unnecessary drag.
Sources: www.nrcan.gc.ca
Step-by-Step Guide to Estimating Your Next Road Trip Budget
To create a highly accurate, realistic fuel budget for an upcoming trip, do not rely solely on theoretical calculations. Follow this structured, step-by-step decision-making framework:
Step 1: Map Your Route and Identify Key Waypoints. Use a reliable mapping service to plot your exact route. Note the total distance, but also identify areas of high elevation change, potential traffic bottlenecks, and urban centers where stop-and-go driving is inevitable. Add a 5% to 10% distance buffer to account for detours, scenic lookouts, and driving around your destination.
Step 2: Determine Your Vehicle's Realistic Fuel Economy. Do not use the EPA's combined rating blindly. If your trip is 90% highway driving, start with the highway rating. Then, apply adjustments based on your specific conditions: subtract 10% if you plan to drive at speeds above 70 mph, subtract 15% if you are traveling in temperatures below 32°F (0°C), subtract 10% to 20% if you are using a roof-mounted cargo box, and subtract 2% for every 200 pounds of passengers and cargo.
Step 3: Research Regional Fuel Prices. Fuel prices vary dramatically across state lines, national borders, and between urban and rural areas. Use real-time tracking tools such as the U.S. Energy Information Administration (EIA) reports or consumer-facing apps to check average prices along your route. Always budget using the price of the specific fuel grade your vehicle requires (regular, mid-grade, premium, or diesel).
Step 4: Execute the Calculation. Apply the adjusted fuel economy and regional fuel prices to the core formulas outlined in Section 1.
Step 5: Establish a Contingency Fund. Fuel prices can fluctuate rapidly due to geopolitical events, refinery maintenance, or seasonal transitions. Always add a 10% to 15% financial buffer to your final calculated cost to absorb unexpected price spikes or additional driving.
Sources: www.eia.gov, www.fueleconomy.gov
Actionable Strategies to Maximize Fuel Efficiency on the Road
While you cannot control the weather or the terrain of your route, you have total control over your driving habits and vehicle maintenance. Implementing the following evidence-based strategies can yield substantial savings on your next road trip:
Drive Sensibly and Smoothly: Aggressive driving—characterized by rapid acceleration, tailgating, and hard braking—is highly inefficient. On the highway, aggressive driving can lower your fuel economy by 15% to 30%, while in stop-and-go city traffic, it can reduce efficiency by 10% to 40%. Smooth, progressive acceleration and coasting to a stop whenever possible conserve momentum and save fuel.
Utilize Cruise Control Strategically: On flat, open highways, engaging your vehicle's cruise control helps maintain a highly consistent speed, preventing the micro-adjustments of the accelerator pedal that waste fuel. However, deactivate cruise control in highly mountainous terrain; cruise control systems often attempt to maintain a strict speed by downshifting aggressively and revving the engine, whereas a human driver can allow speed to drop slightly on the uphill and recover it on the downhill more efficiently.
Maintain Correct Tire Pressure: Check your tire pressure before embarking on your trip, ideally when the tires are cold. Always inflate them to the manufacturer's recommended pressure listed on the placard inside the driver's door jamb, not the maximum pressure stamped on the tire sidewall. Properly inflated tires reduce rolling resistance and improve safety.
Minimize Idling: Modern internal combustion engines are highly efficient but burn fuel continuously when idling. If you need to pull over to read a map, wait for a passenger, or sit at a rest stop for more than 60 seconds, turn off your engine. Modern engines do not require a warm-up period beyond 30 seconds; driving gently is the fastest and most fuel-efficient way to bring the engine to operating temperature.
Optimize Your Vehicle's Aerodynamics: Keep windows rolled up at highway speeds to minimize cabin turbulence and drag. Use the air conditioning instead, as modern AC compressors have a smaller efficiency penalty at high speeds than the aerodynamic drag of open windows. Conversely, at low city speeds, roll down the windows and turn off the AC to save fuel.
Sources: www.fueleconomy.gov, www.nrcan.gc.ca